
Most day traders lose. A weekly review shows where you stand
Day trading has been studied closely, and the findings are humbling. In Taiwan, where every trade is on record, researchers found that less than 1% of day traders could predictably and reliably beat the market after fees between 1992 and 2006 (Barber, Lee, Liu and Odean, 2014). And more activity doesn’t close the gap on its own. In a study of 66,465 US brokerage households, the ones that traded most earned 11.4% a year while the market returned 17.9% over 1991 to 1996 (Barber and Odean, 2000).
Neither number says you can’t do well. They say the default outcome is falling short, and that being busy isn’t the same as getting better. A regular review won’t make anyone profitable, but it turns “how am I really doing?” from a feeling into a number, every week, before a bad habit has a year to cost you.
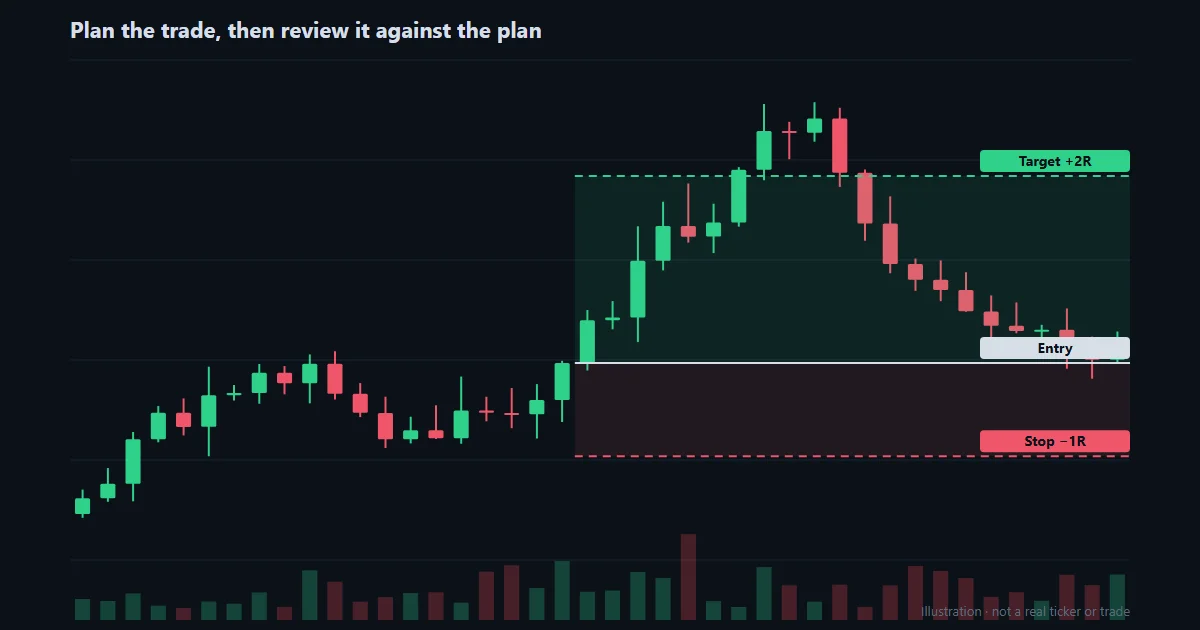
The 30-minute weekly review
Pick the same time every week, after the Friday close or before Monday’s open. Look only at the past five sessions, and check these five numbers in order.
1. Net per trade, after costs
Total P&L hides how much work it took. Net per trade tells you what a typical trade was worth once commissions and fees came out. If it’s close to zero, small changes in your costs or your fills decide whether the week was green.
2. Your average winner against your average loser
This is the payoff ratio. A 70% win rate means little if the average loser is three times the average winner. Many struggling traders win often and lose big. Put the two side by side and the problem names itself.
3. Time in winners against time in losers
If you hold losers longer than winners, you’re hoping on the trades that are going against you and taking quick profits on the ones that are working. It’s one of the most common leaks in a day trader’s book, and it rarely shows up in a P&L total.
4. Your longest losing streak
Not to feel bad about it, but to check what happened during it. Did size go up after the second loss? Did trade count jump? A streak is where a rule about stopping for the day earns its keep.
5. Average R, and how many trades it covers
Dollar results move with size. Measured in R, every trade is scored against what you planned to lose, so a disciplined small loss and an outsized loss stop looking alike. Count how many of the week’s trades had a risk recorded; an average over two trades isn’t an average. More on R-multiples.
Then write down one change
Five numbers, one decision. Keep the change specific and testable: “no new trades after two full-R losses”, “stop out at the stop, no moving it”, “size down in the first five minutes”. Next week’s review checks whether you kept it, and whether the numbers moved.
Doing it in SpiceLog
Every number above is on the Stats tab of Reports, which sets all trades, winners and losers side by side: net per trade, average winner and loser, payoff ratio, time in winners and time in losers, longest win and loss streaks, and average R with the count of trades it covers. Use Filter to set the date range to the week, and save it under Saved views to come back to it in one click. Switch between dollars and R at the top of the page.
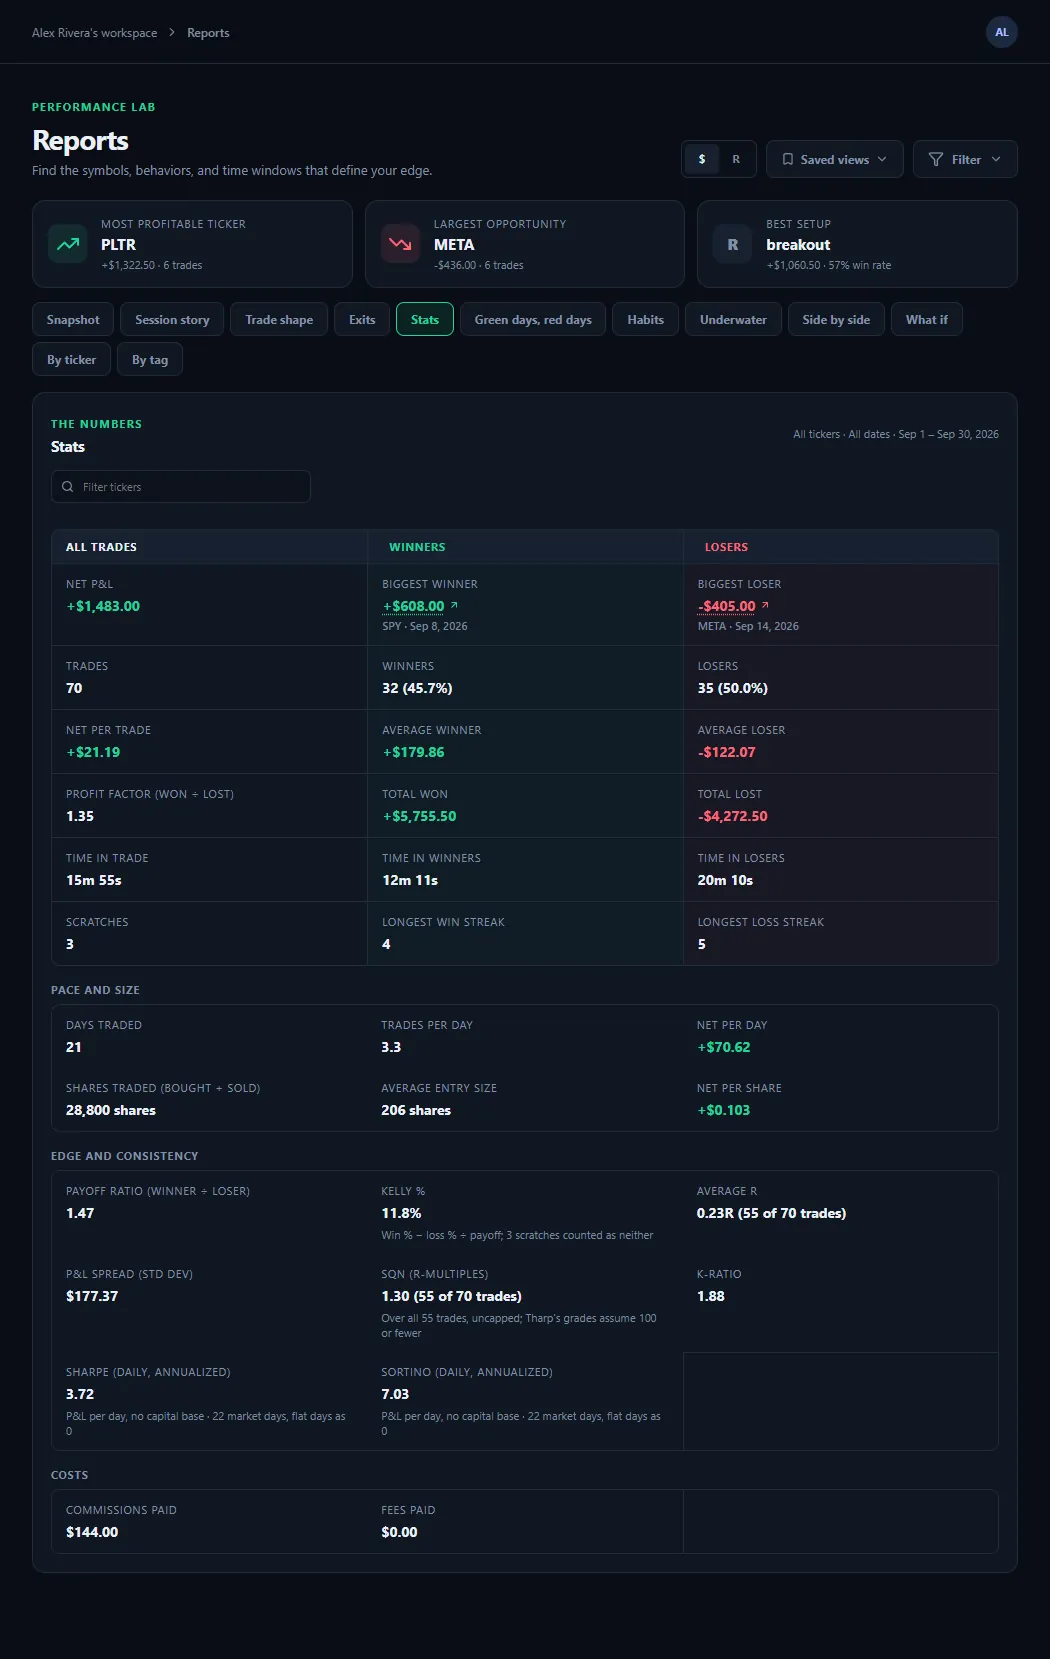
If you tag your trades by setup, the By tag tab shows the same question one level down: which setups have made money, and which have cost it.
Need to get your trades in first? Start with how to export your DAS Trader Pro trade log, or bring your history across from Tradervue.
For education only, not investment advice. DAS Trader Pro is a trademark of DAS Inc., and Tradervue of its owner; SpiceLog is independent and not affiliated with or endorsed by either.