
Why traders hold losing trades too long, and how to catch it in your numbers
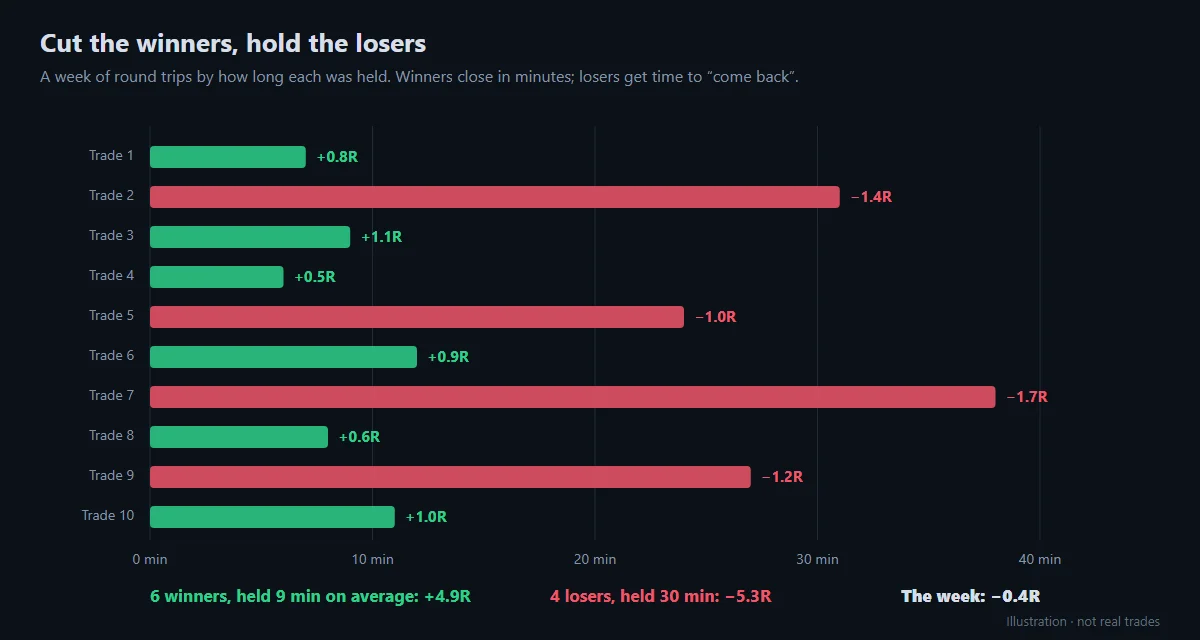
Every trader knows the rule: cut losers short and let winners run. Most of us trade the other way round. In a classic study of discount-brokerage accounts, Terrance Odean found that investors realized about 14.8% of the gains available to them but only 9.8% of the losses, so gains were taken roughly 1.5 times as readily (Odean, 1998). It is called the disposition effect, and it isn't only a long-term investor’s problem. On an intraday chart it looks like a quick profit taken the moment it appears, and a loser given “a little more room” until the stop is a memory.
Why it happens
- A loss isn’t real until you close it. Holding keeps the hope that it comes back.
- A win feels like it could vanish. Taking it locks in the good feeling, even when the trade had further to go.
- The stop moves. “Just a little more room” is how a planned −1R loss turns into −1.7R.
How it shows up in your numbers
You don’t need to guess whether you do it. Three checks on your own trades will tell you:
- Time in losers against time in winners. If your losers are held clearly longer, the habit is there.
- Losses beyond −1R. A stop you keep caps a loss near −1R. Losses of −1.5R or worse are mostly stops that weren’t kept.
- P&L by how long you held. Split your trades into hold-time bands. If the longest holds are where the money goes, you are waiting on losers.
Breaking the habit
- Decide the exit before the entry. Write down the stop, and size the position so that hitting it is bearable.
- Treat the stop as an order, not a suggestion. A resting stop takes the decision away from the moment you are worst at making it.
- Give winners a rule too. A target, a trailing stop or a time limit, so the exit is a plan rather than relief.
- Review it every week. Watch one number: the gap between your time in losers and your time in winners. The goal is to see it close.
Seeing it in SpiceLog
The Stats tab in Reports shows Time in winners and Time in losers side by side. The Trade shape tab breaks your P&L down by How long each trade was held, so you can see which hold times make money and which cost it. Switch to R once your trades carry a risk, and a loss past −1R stands out as a stop that wasn’t kept. More on R-multiples.
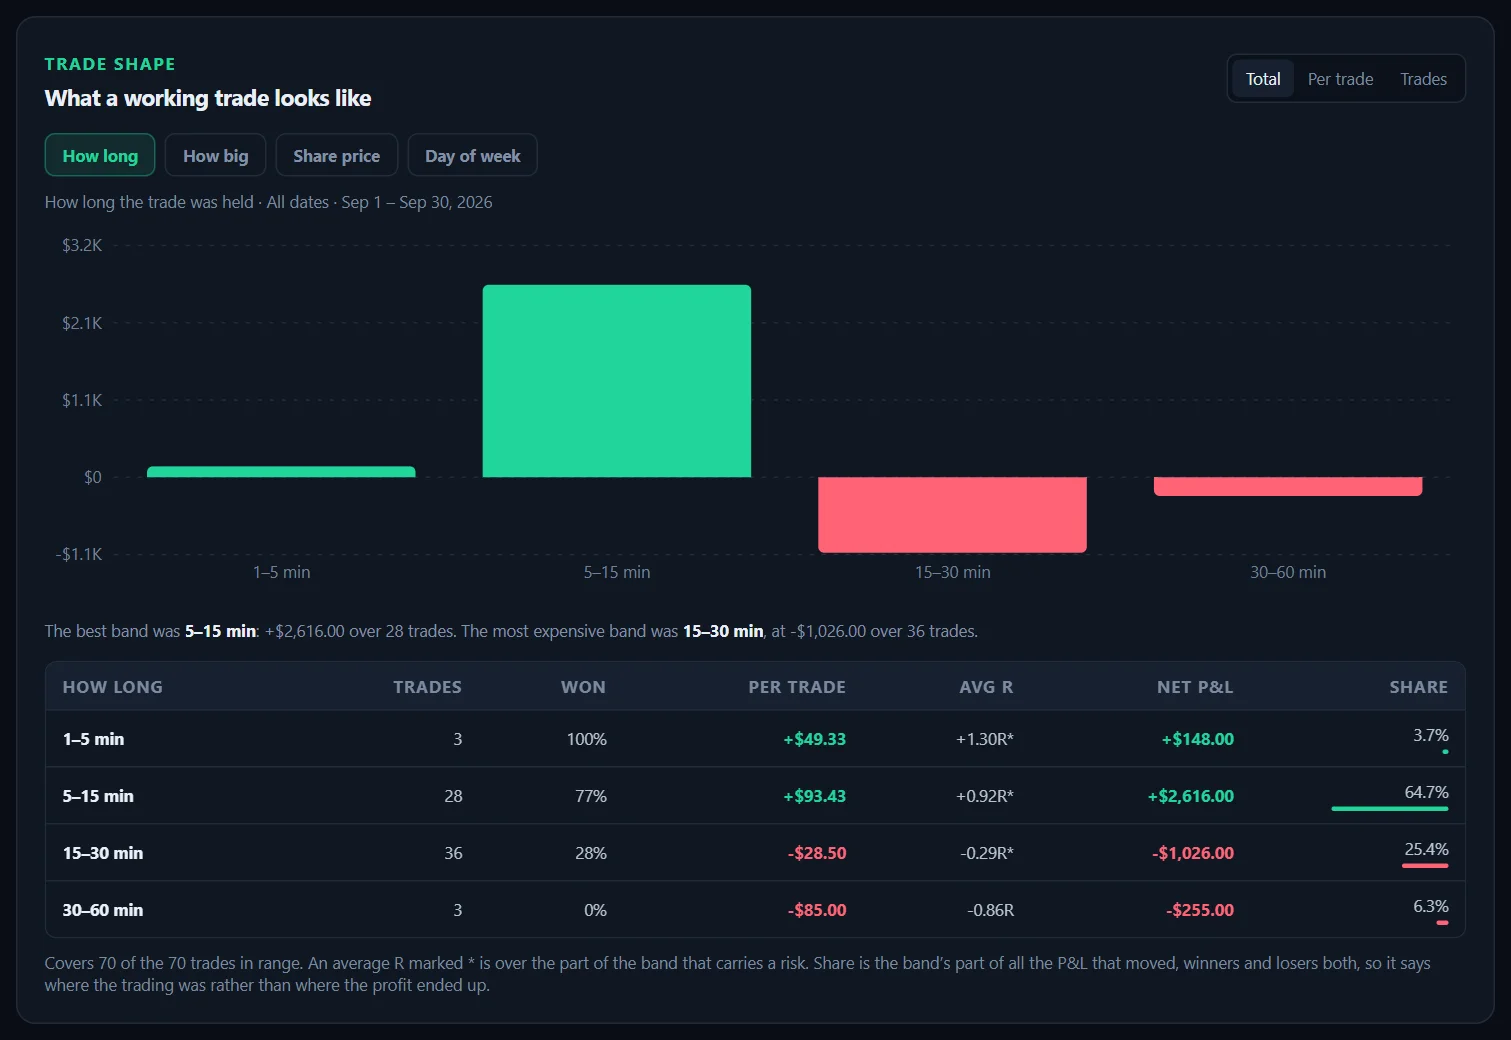
Make it part of a weekly review, and the gap between your two hold times becomes one number to bring down.
For education only, not investment advice. DAS Trader Pro is a trademark of DAS Inc., and Tradervue of its owner; SpiceLog is independent and not affiliated with or endorsed by either.